Progressive React
Performance advocates, like myself, spend a lot of time “advocating” for faster sites. At times however, we don’t cover framework-specific optimizations that can be important to consider if you use a particular framework for your site.
This article will cover a number of performance optimizations you can add to your React sites. The key idea here is to ensure your site performs well enough so that more people can use it.
Introduction
What does it mean to build a site that more people can use? How does this get measured? Why should this get measured?
Let’s try and answer this question by taking a look at the easiest way to start building a React app - Create React App. A brand new project from scratch has the following dependencies:
- The
reactcore library that lets you build things with React components: 2.5 kB - The
react-domlibrary to render your components to the DOM: 30.7 kB - Some initial code including your first component: ~3 kB
The numbers here are from v16.6.3.
WebPageTest can be used to see how long it would take for a brand new CRA application to load on a Moto G4.
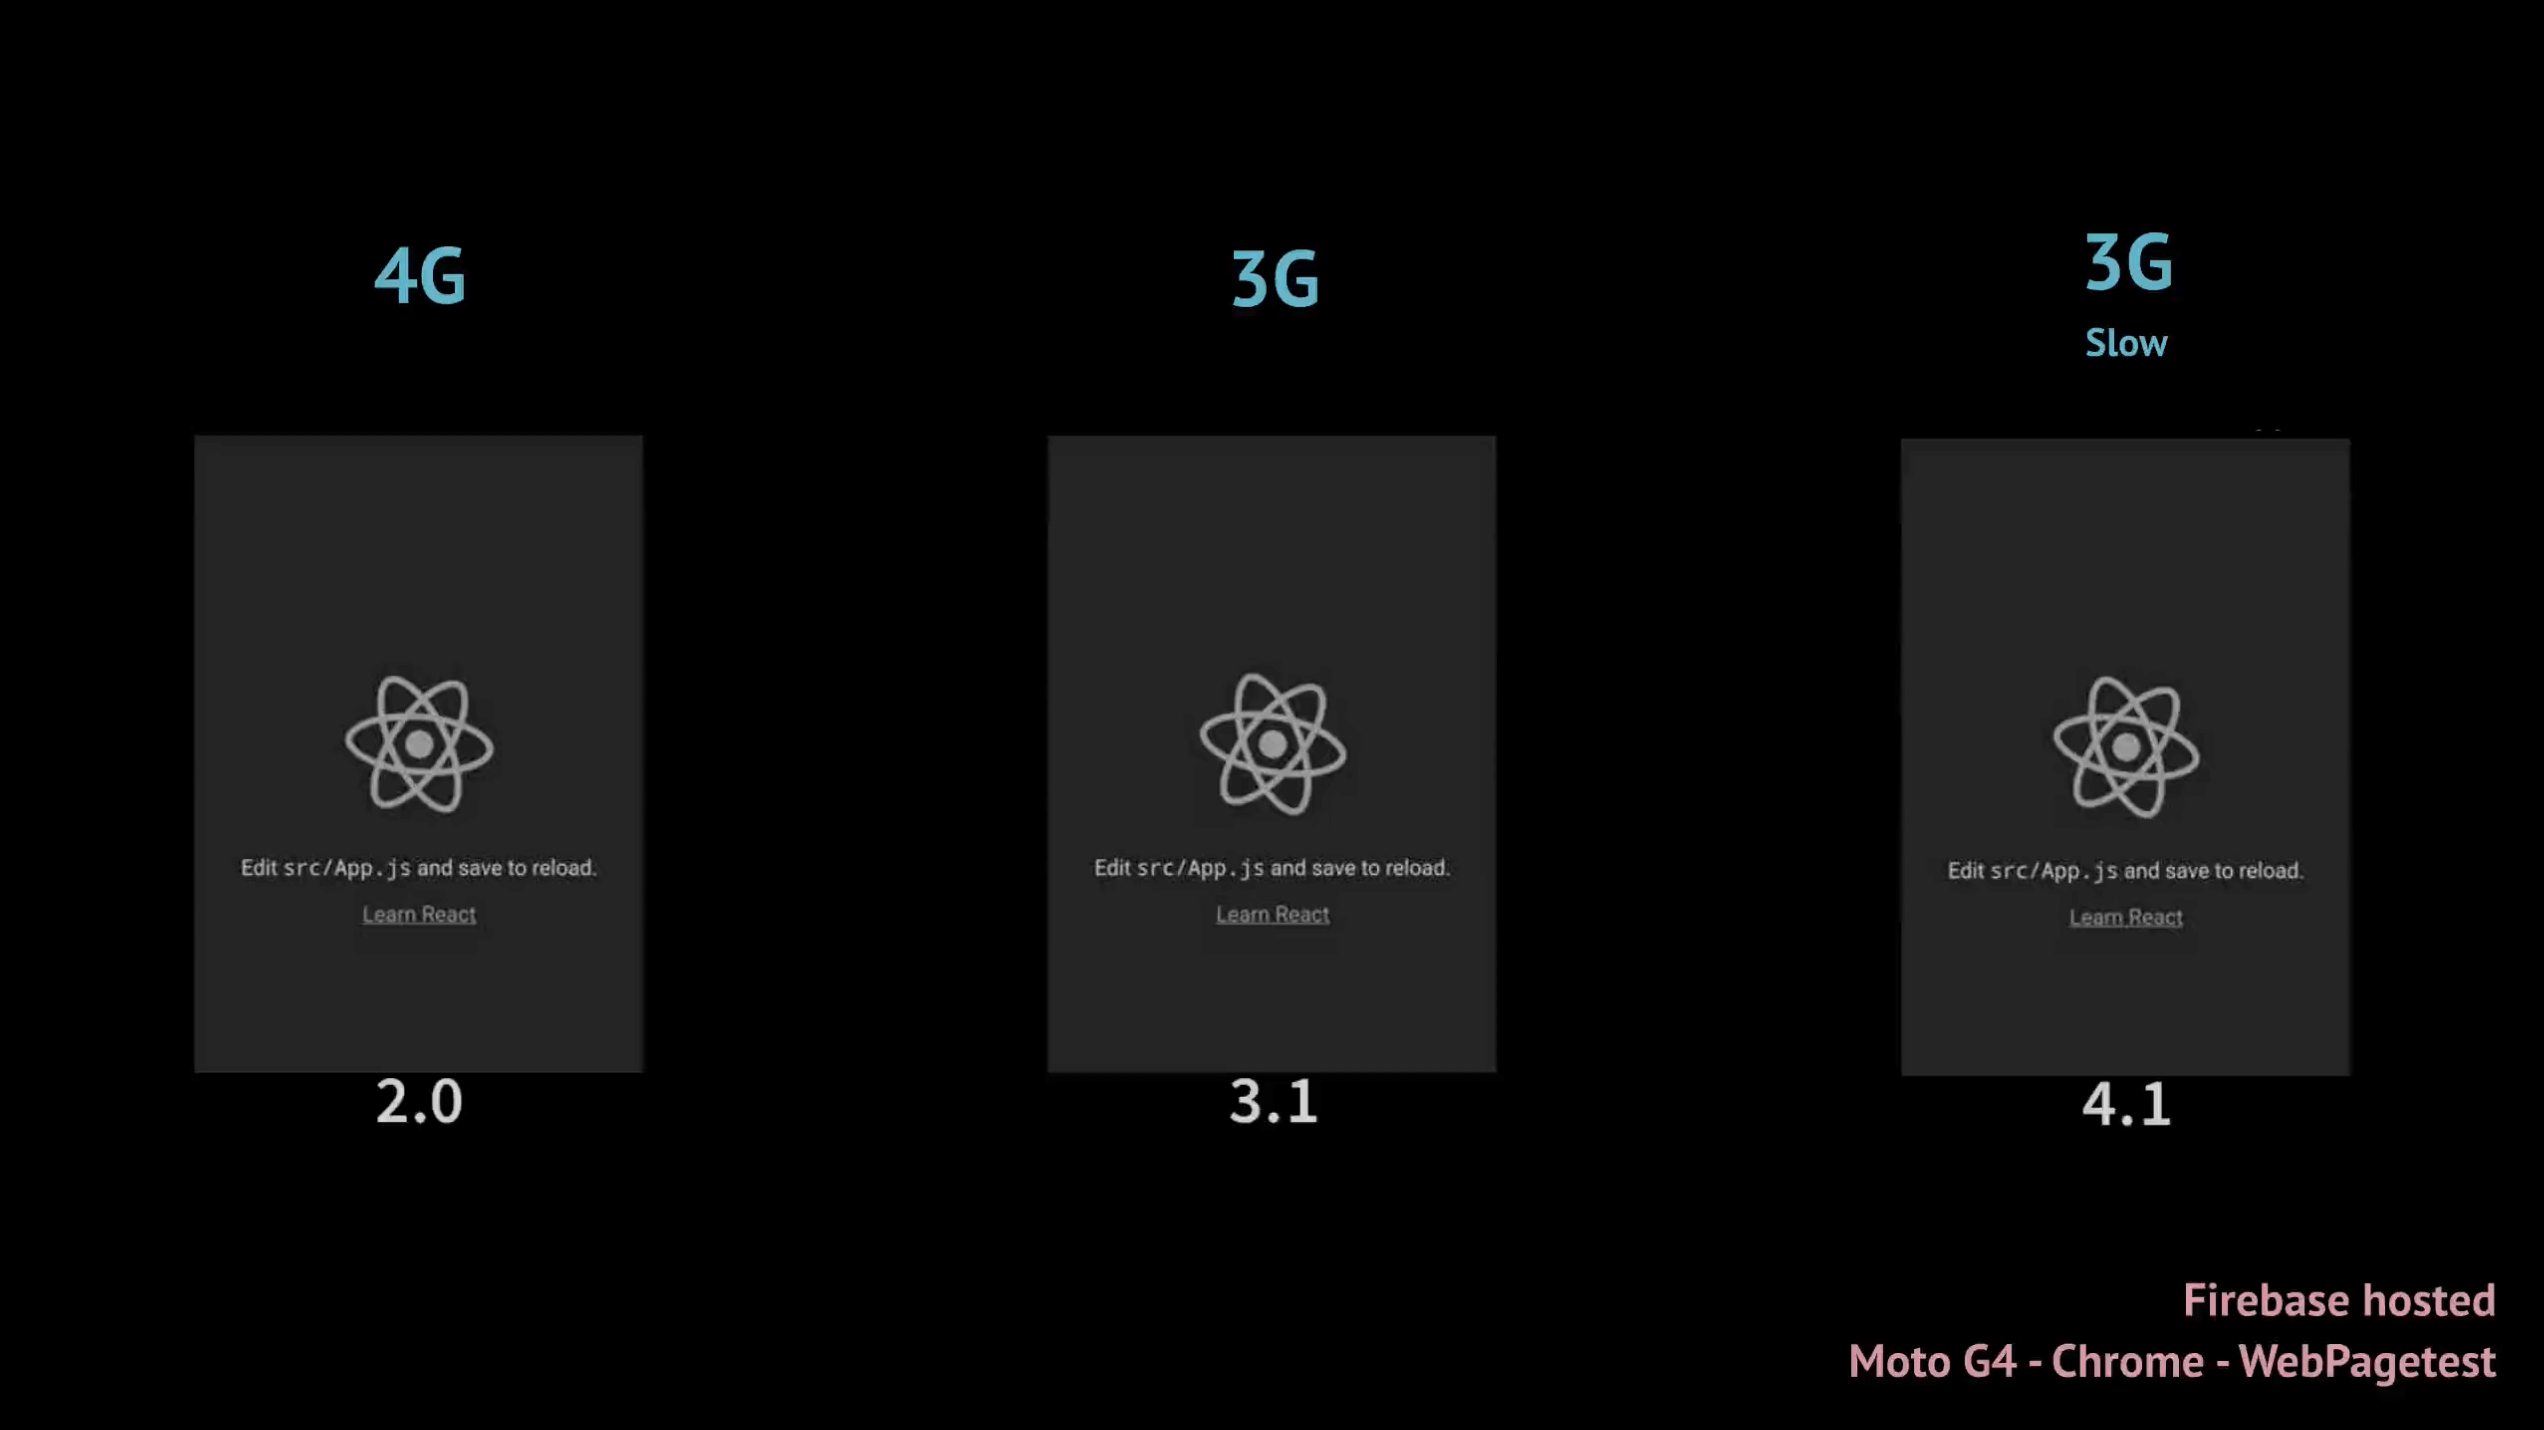
This “Hello, World” application is hosted on Firebase and viewed on Chrome with three different network connection types:
- 4G (9 Mbps)
- 3G (1.6 Mbps)
- 3G Slow (400 Kbps)
Some latency needs to be accounted as well.
Why use a Moto G4? It’s a low-end mobile phone similar to what many people use in developing countries as their primary device. On 4G, the application finishes loading in 2 seconds. In 3G Slow, it takes more than 4 seconds for the page to become interactive.
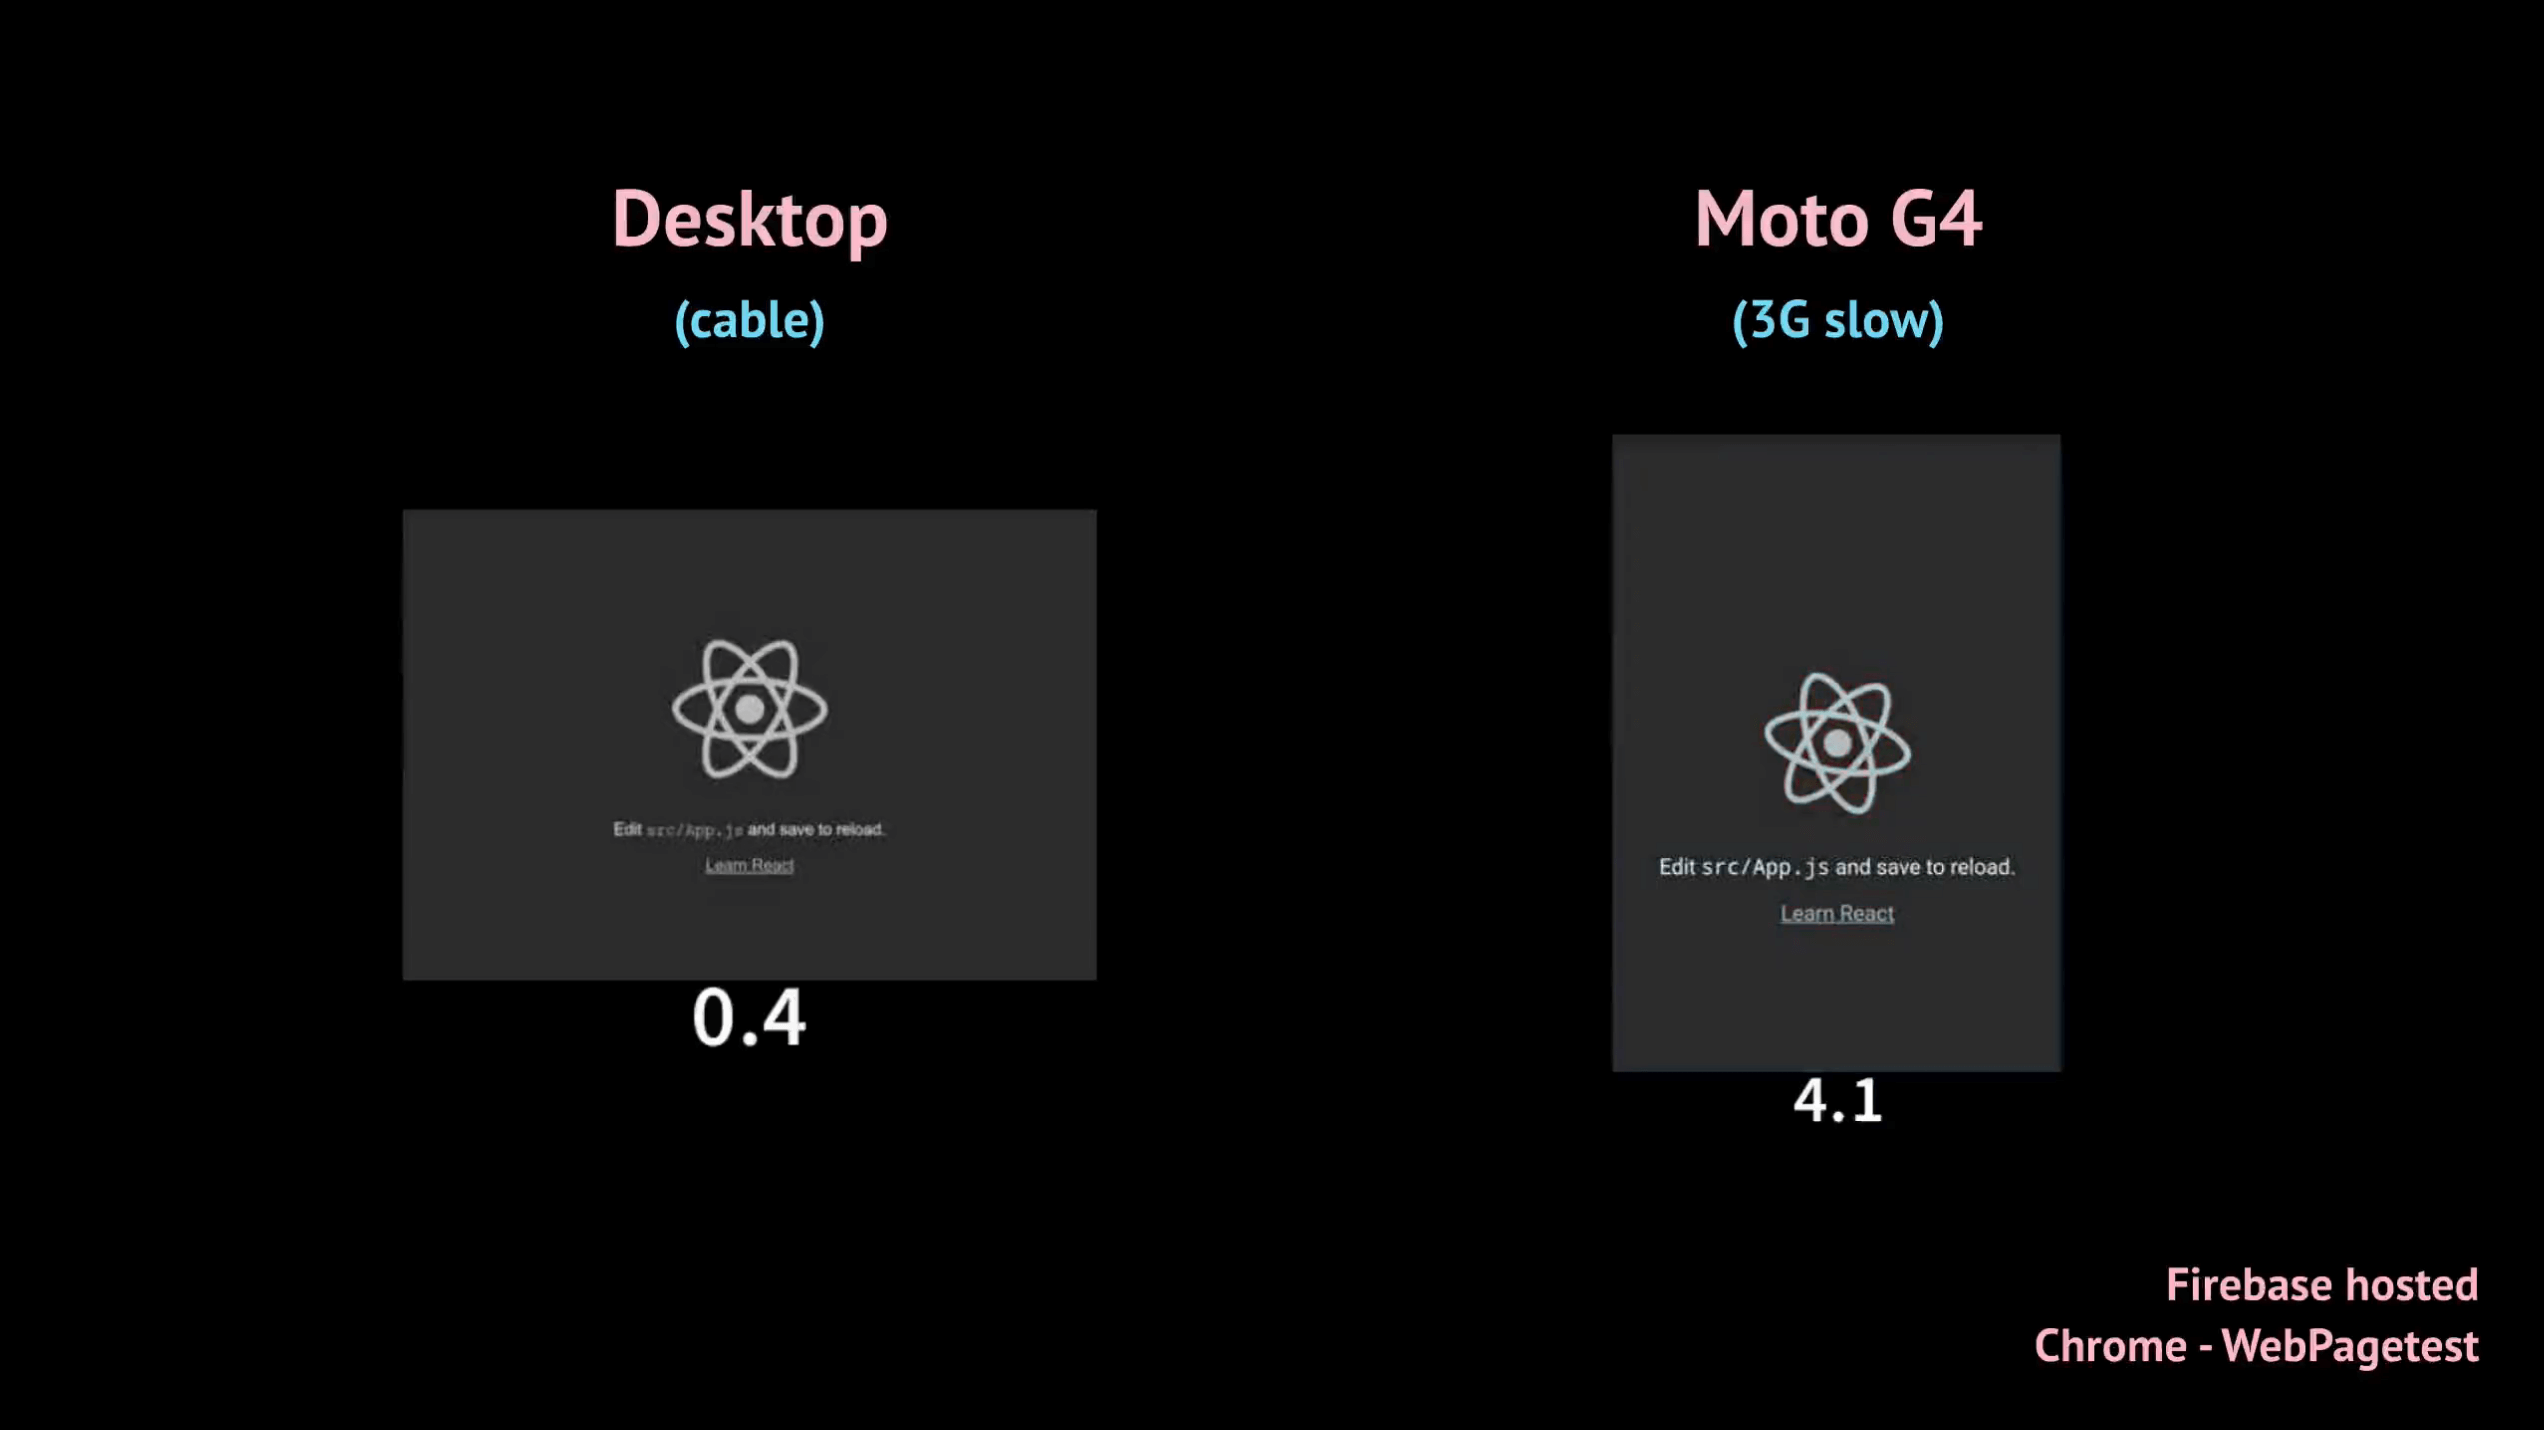
As interesting as these numbers may seem, they aren’t very useful if you don’t know who your users are. Your definition of slow can be completely different from mine or somebody else’s, and your perception on how fast a site loads can be skewed to the device and network connection that you use. Including a desktop machine (with cable connection) in this experiment shows how drastic the difference can be:
Can we measure the current state of performance?
A typical React application can contain many components and third-party libraries. This means that the performance of a “Hello World” app doesn’t give much insight into how fast an actual application might load, but is there a way to track how well a majority of sites that use a specific tool (like React) perform?
HTTP Archive might be able to help. It’s an open-source attempt to keep track of how the web is built, and it does this by crawling over a million sites every month, running them through WebPagetest, and then storing information about them. This includes the number of requests, loading metrics, size of payloads, and so on.
Library-Detector-for-Chrome is a Chrome extension that can detect which JavaScript libraries are used on a page. It was recently included as a diagnostic audit to Lighthouse which means that this information can be queried en masse through HTTP Archive. This can help provide a way to analyze results of thousands of sites that use a specific JavaScript library (the React detection mechanism lives here).
The complete HTTP Archive dataset is public and available on BigQuery. After querying over 140,000 domains in emulated mobile conditions (2019_01_01 dataset) that use React, the following results were found:
- Median First Meaningful Paint: 6.9s
- Median Time to Interactive: 19.7s
Almost 20 seconds for a site to become interactive is no joke, but it’s not uncommon to see on large sites using weaker devices and network connections. Also, there are a few reasons why you should take these numbers with a grain of salt:
- There are a lot of other factors involved that affect the performance of a site, such as the total amount of JavaScript that gets shipped, the number of images and other assets rendered on a page and so forth. It’s not fair to measure site performance against a single horizontal (“is React is used on a page” for example) if all of these other factors aren’t taken into account.
- Replace “React” with any other client-side framework/library in that query and you’ll see similar numbers.
There’s a lot of work that needs to be done before an accurate assessement can be made for how sites in the wild that use a particular library generally perform.
MOAR JavaScript
One thing that is not specific to a particular library is the amount of JavaScript that we’re generally shipping over the wire. The HTTP Archive already provides a handy report for this, but in short, the median JavaScript bytes sent were:
- 74.7 KB for mobile webpages in December 15, 2011
- 384.4 KB for mobile webpages in December 15, 2018
But wait, this includes over a million URLs! There has to be thousands of random sites that skew these results right?
Fair point. Let’s try to find the same results but for the top 10,000 Alexa sites:
- 381.5 KB for mobile webpages in December 15, 2018 (Query)
As a whole, we’re building websites that ship more JavaScript than we did seven years ago, and this makes sense. Sites have become bigger, more interactive and more complex and this number is still gradually increasing in an upward trend year after year. You may have already heard this before, but the more JavaScript you send to the browser, the more time it needs to be parsed, compiled and executed. Consequently, this slows down your site.
It’s important to note that every site and user base is different. Many developers that ship over 300 KB of JavaScript do not have a problem with how well it performs for most of their users, and that’s fine. However, if you happen to be concerned that the performance of your React site could be better for your users, profiling is always a good first step.
Profiling / Analyzing
Profiling and analyzing a React application can be looked at as a two-fold approach:
- Component-level performance: This affects how users actually interact with your site. Clicking a button to load a list should feel snappy, but it most likely won’t be if hundreds of components are re-rendering when they shouldn’t.
- Initial app-level performance: This affects how soon users can begin interacting with you site. The amount of code that gets shipped to your users as soon as they load the first page is an example of a factor that affects this.
Measure component-level performance
To try and summarize the concept of React’s reconciliation algorithm, or the “virtual DOM”, in a single sentence: React takes steps to diff between a newer DOM tree and an older tree to figure out what needs to be updated in the UI when data is changed within a component. This makes things a lot less performance intensive than re-rendering the entire application with every state/prop change (a difference between O(N3) and O(N)).
Even with these optimizations baked into React internals, you can always run into the problem of having components in an application re-render when they shouldn’t. This might not be noticeable for smaller applications, but it can degrade performance significantly if hundreds of components are being rendered on a page.
There are a number of reasons why components render when they shouldn’t - functions within a component might not be as efficient as they could be, or maybe an entire list of components are being re-rendered when only a single component gets added onto a list. There are tools that you can use to identify which component trees are taking too long to render, such as:
- Chrome DevTools Performance panel
- React DevTools profiler
Analyze performance with the Chrome DevTools Performance Panel
React uses the User Timing API to measure the time a component takes for each step of its lifecycle. You can run performance traces using Chrome DevTools to analyze how efficiently your components mount, render, and unmount during page interactions or reloads.
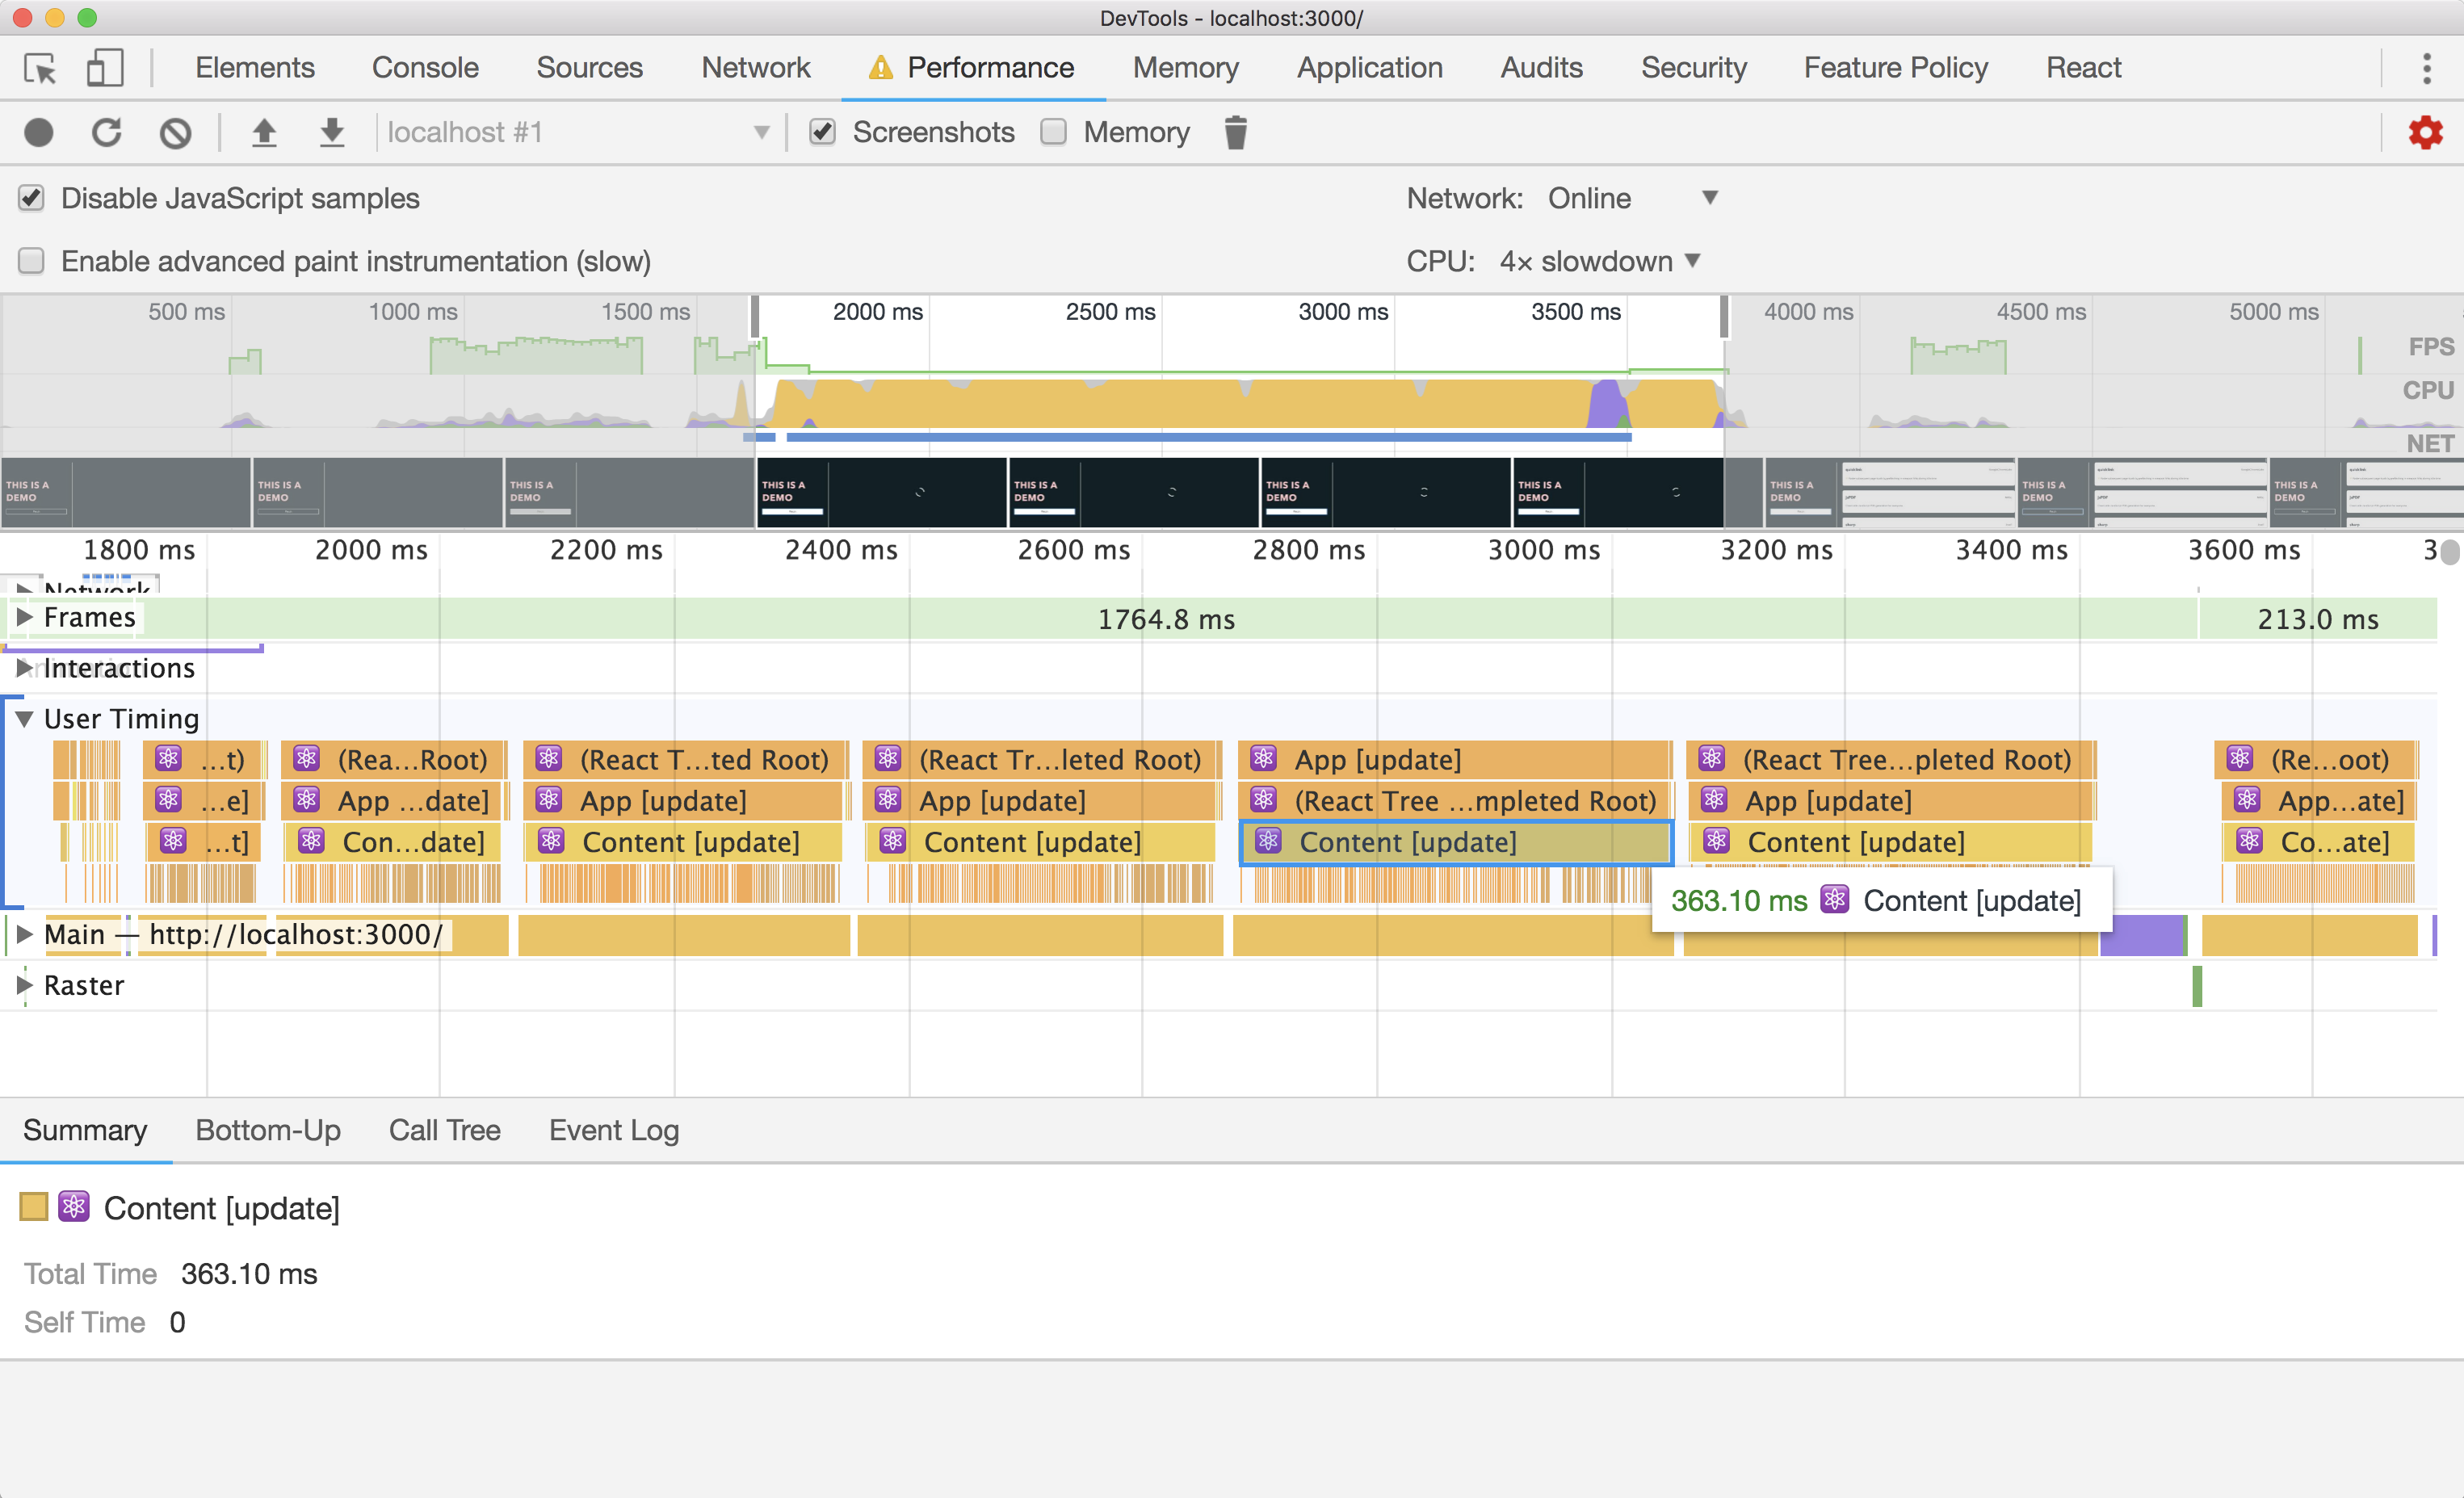
The User Timing API is only used during development and is disabled in production mode. A faster implementation that can be used during production without significantly harming performance was one of the motivations behind building a newer Profiler API..
Analyze performance with the React DevTools Profiler
With react-dom 16.5, a newer Profiler panel within React DevTools can be used to trace how well your components are rendering in terms of performance. It does this by using the Profiler API to collect timing information for every component that re-renders.
The Profiler panel lives as a separate tab within React DevTools. Similar to the Performance panel in Chrome DevTools, you can record user interactions and page reloads to analyze how well your components are performing.

You can switch between different commits, or states when DOM nodes are added, removed, or updated, to get more nuanced data of which components are taking their sweet time to render.
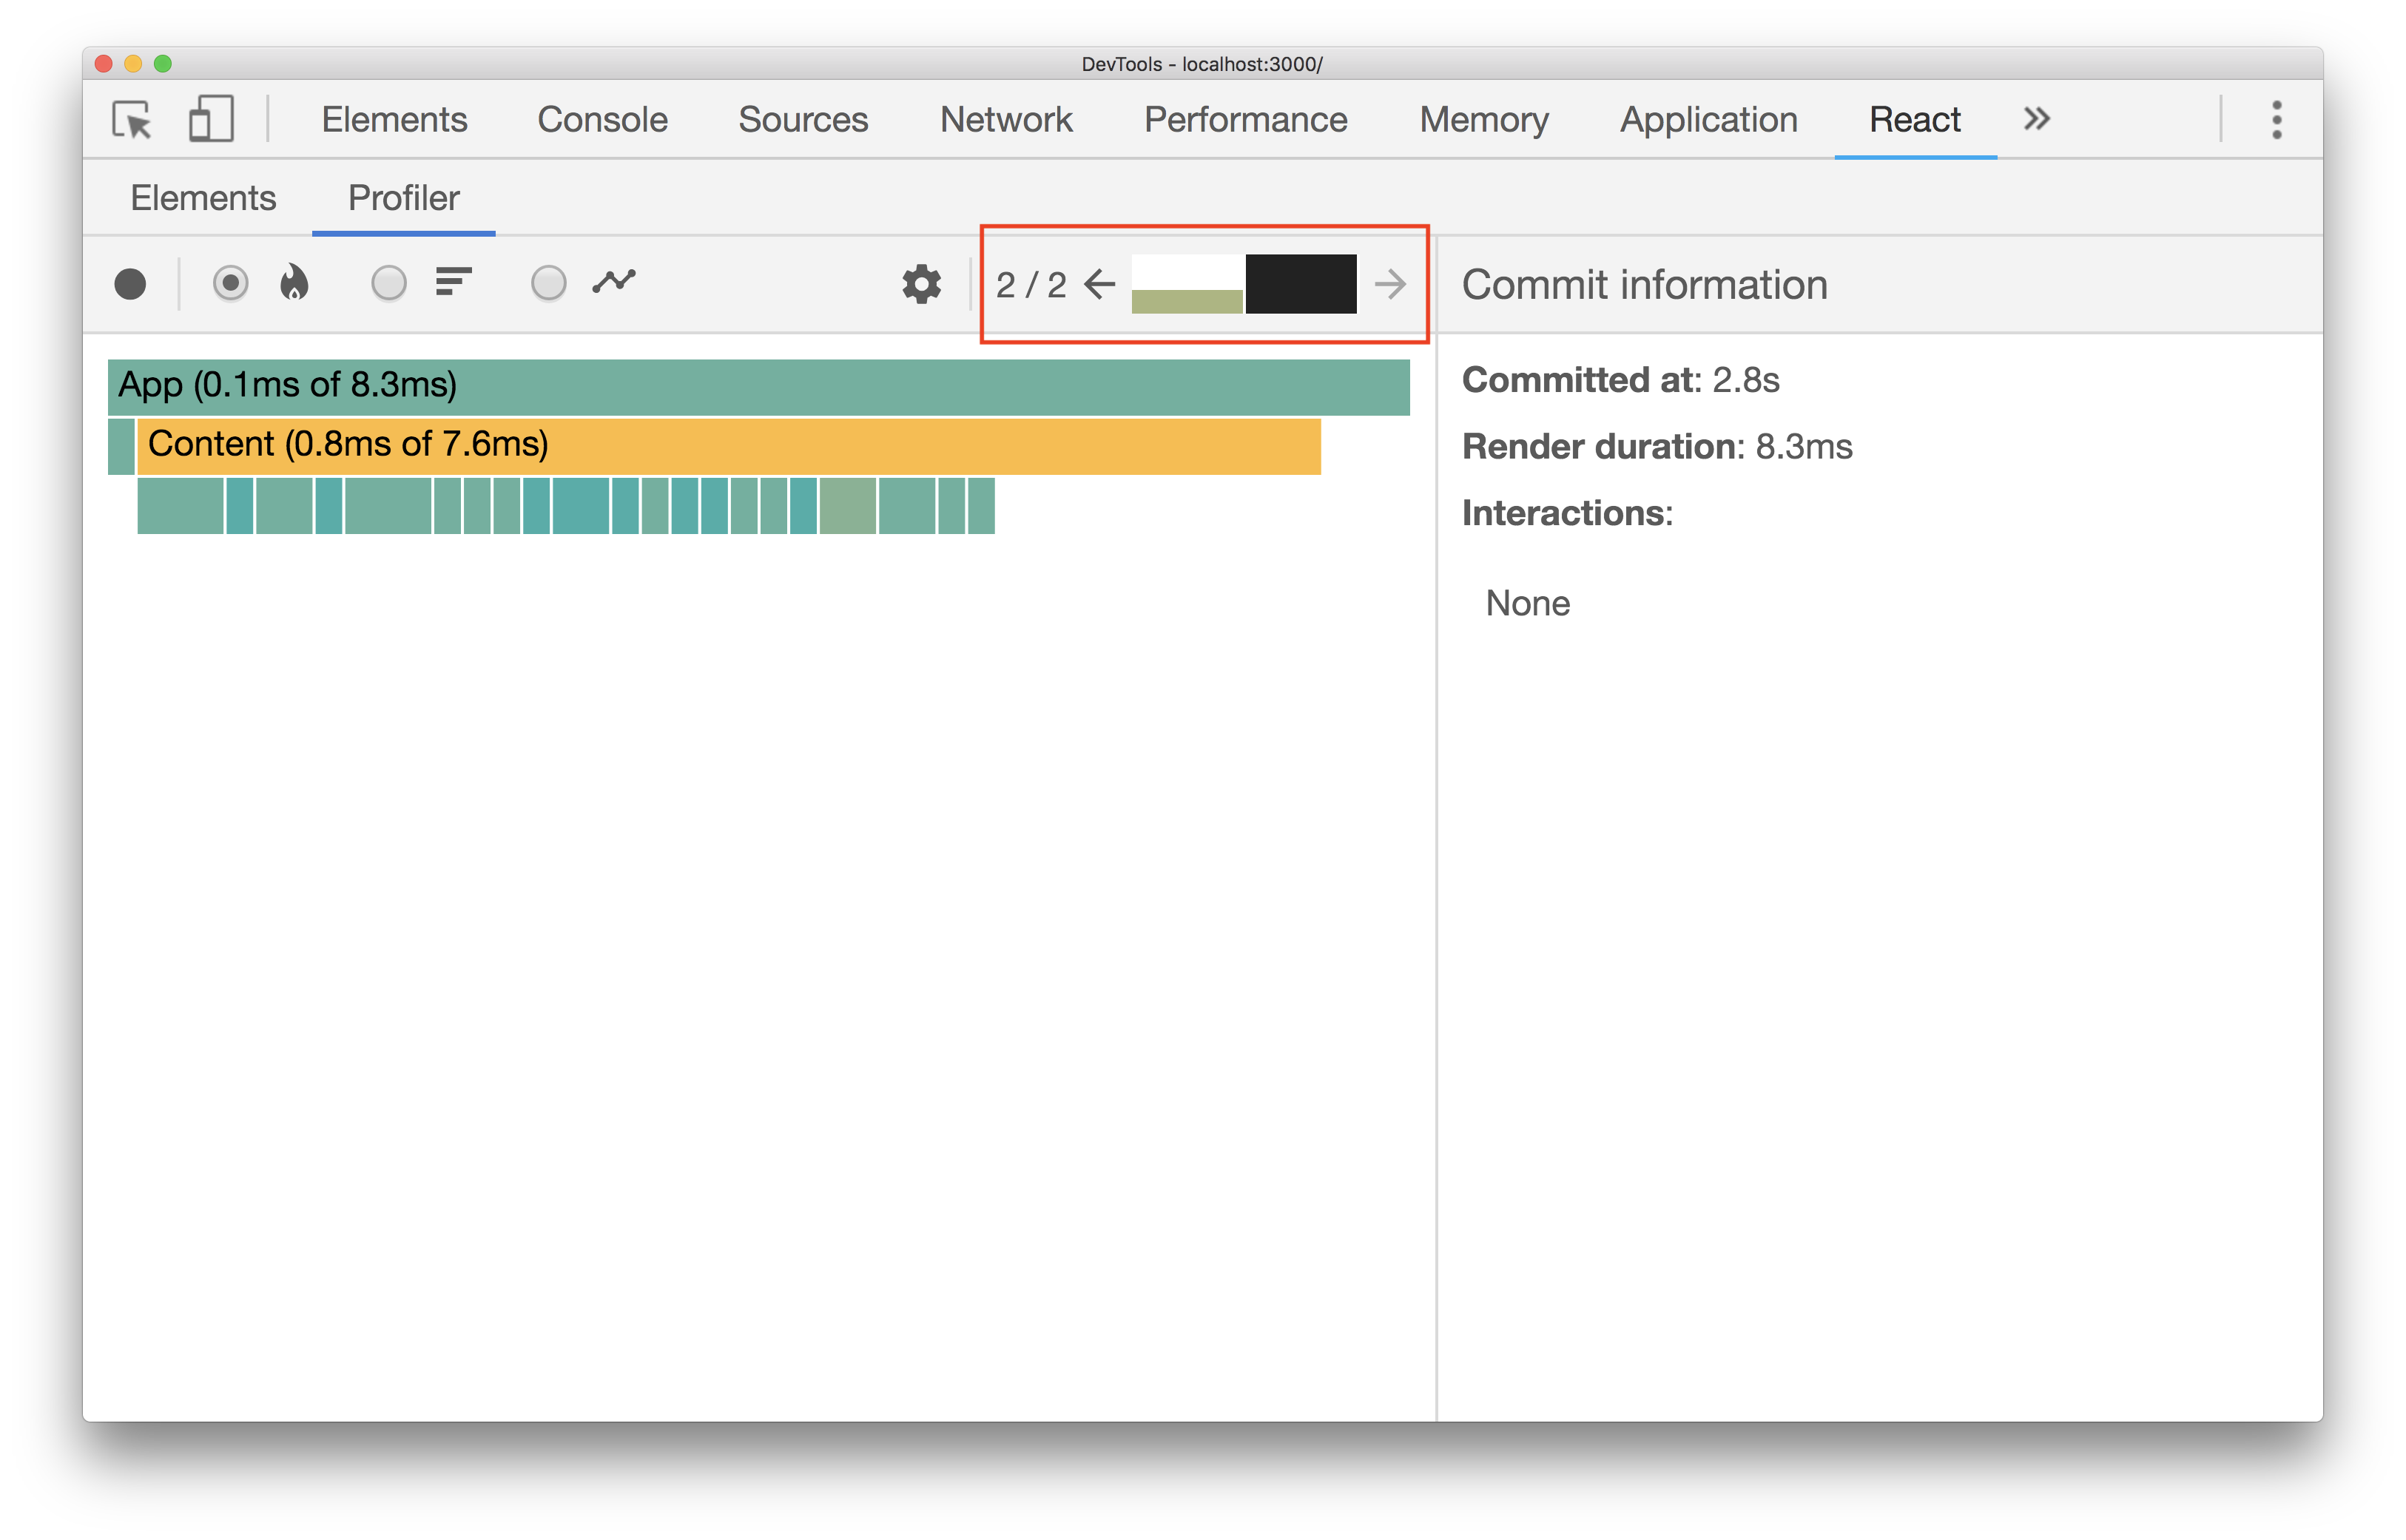
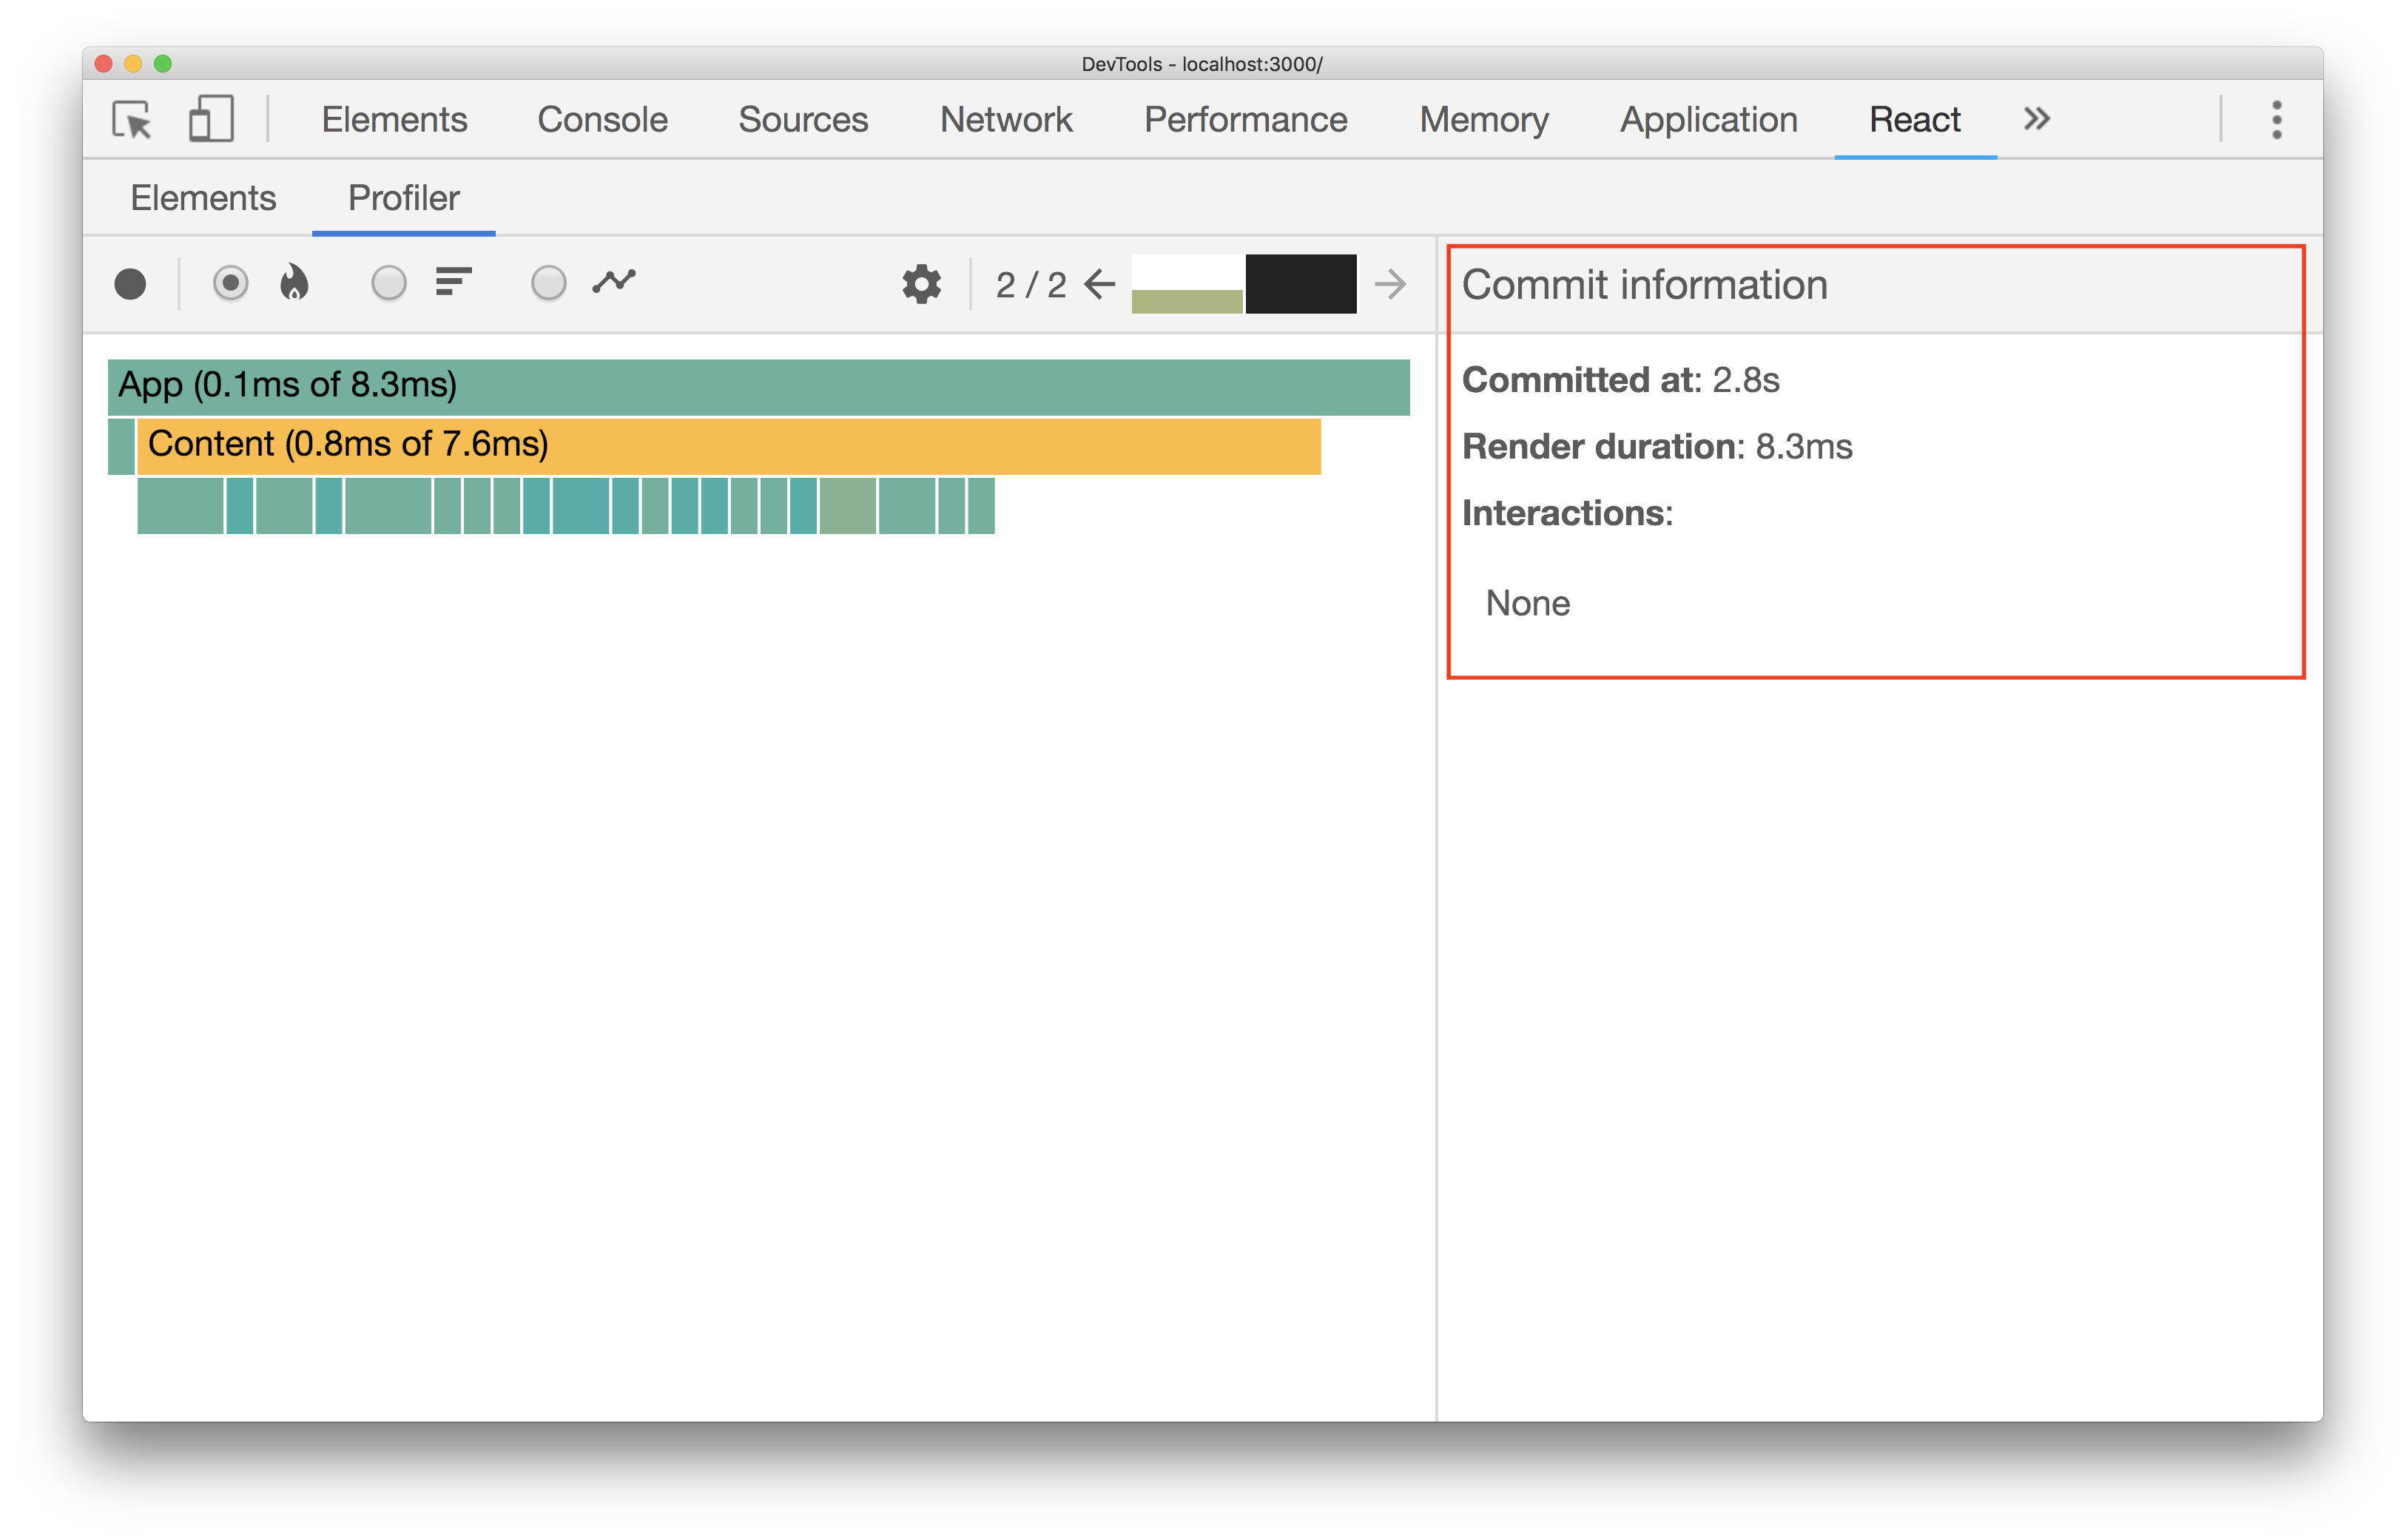
These screenshots are from profiling a single user interaction in a simple app which involves fetching a list of trending GitHub repos when a button is clicked. As you can see, there are only two commits:
- One for a loading indicator that shows when the list of items are fetched
- One after the API call is completed and the list is populated to the DOM
The right hand side shows other useful metadata including commit information or component-specific data such as props and state.
To complicate things up a bit, consider the same example but with multiple API calls being fired to load specific trending repositories based on programming language (JavaScript, Golang, etc…). As expected, there are more commits now:
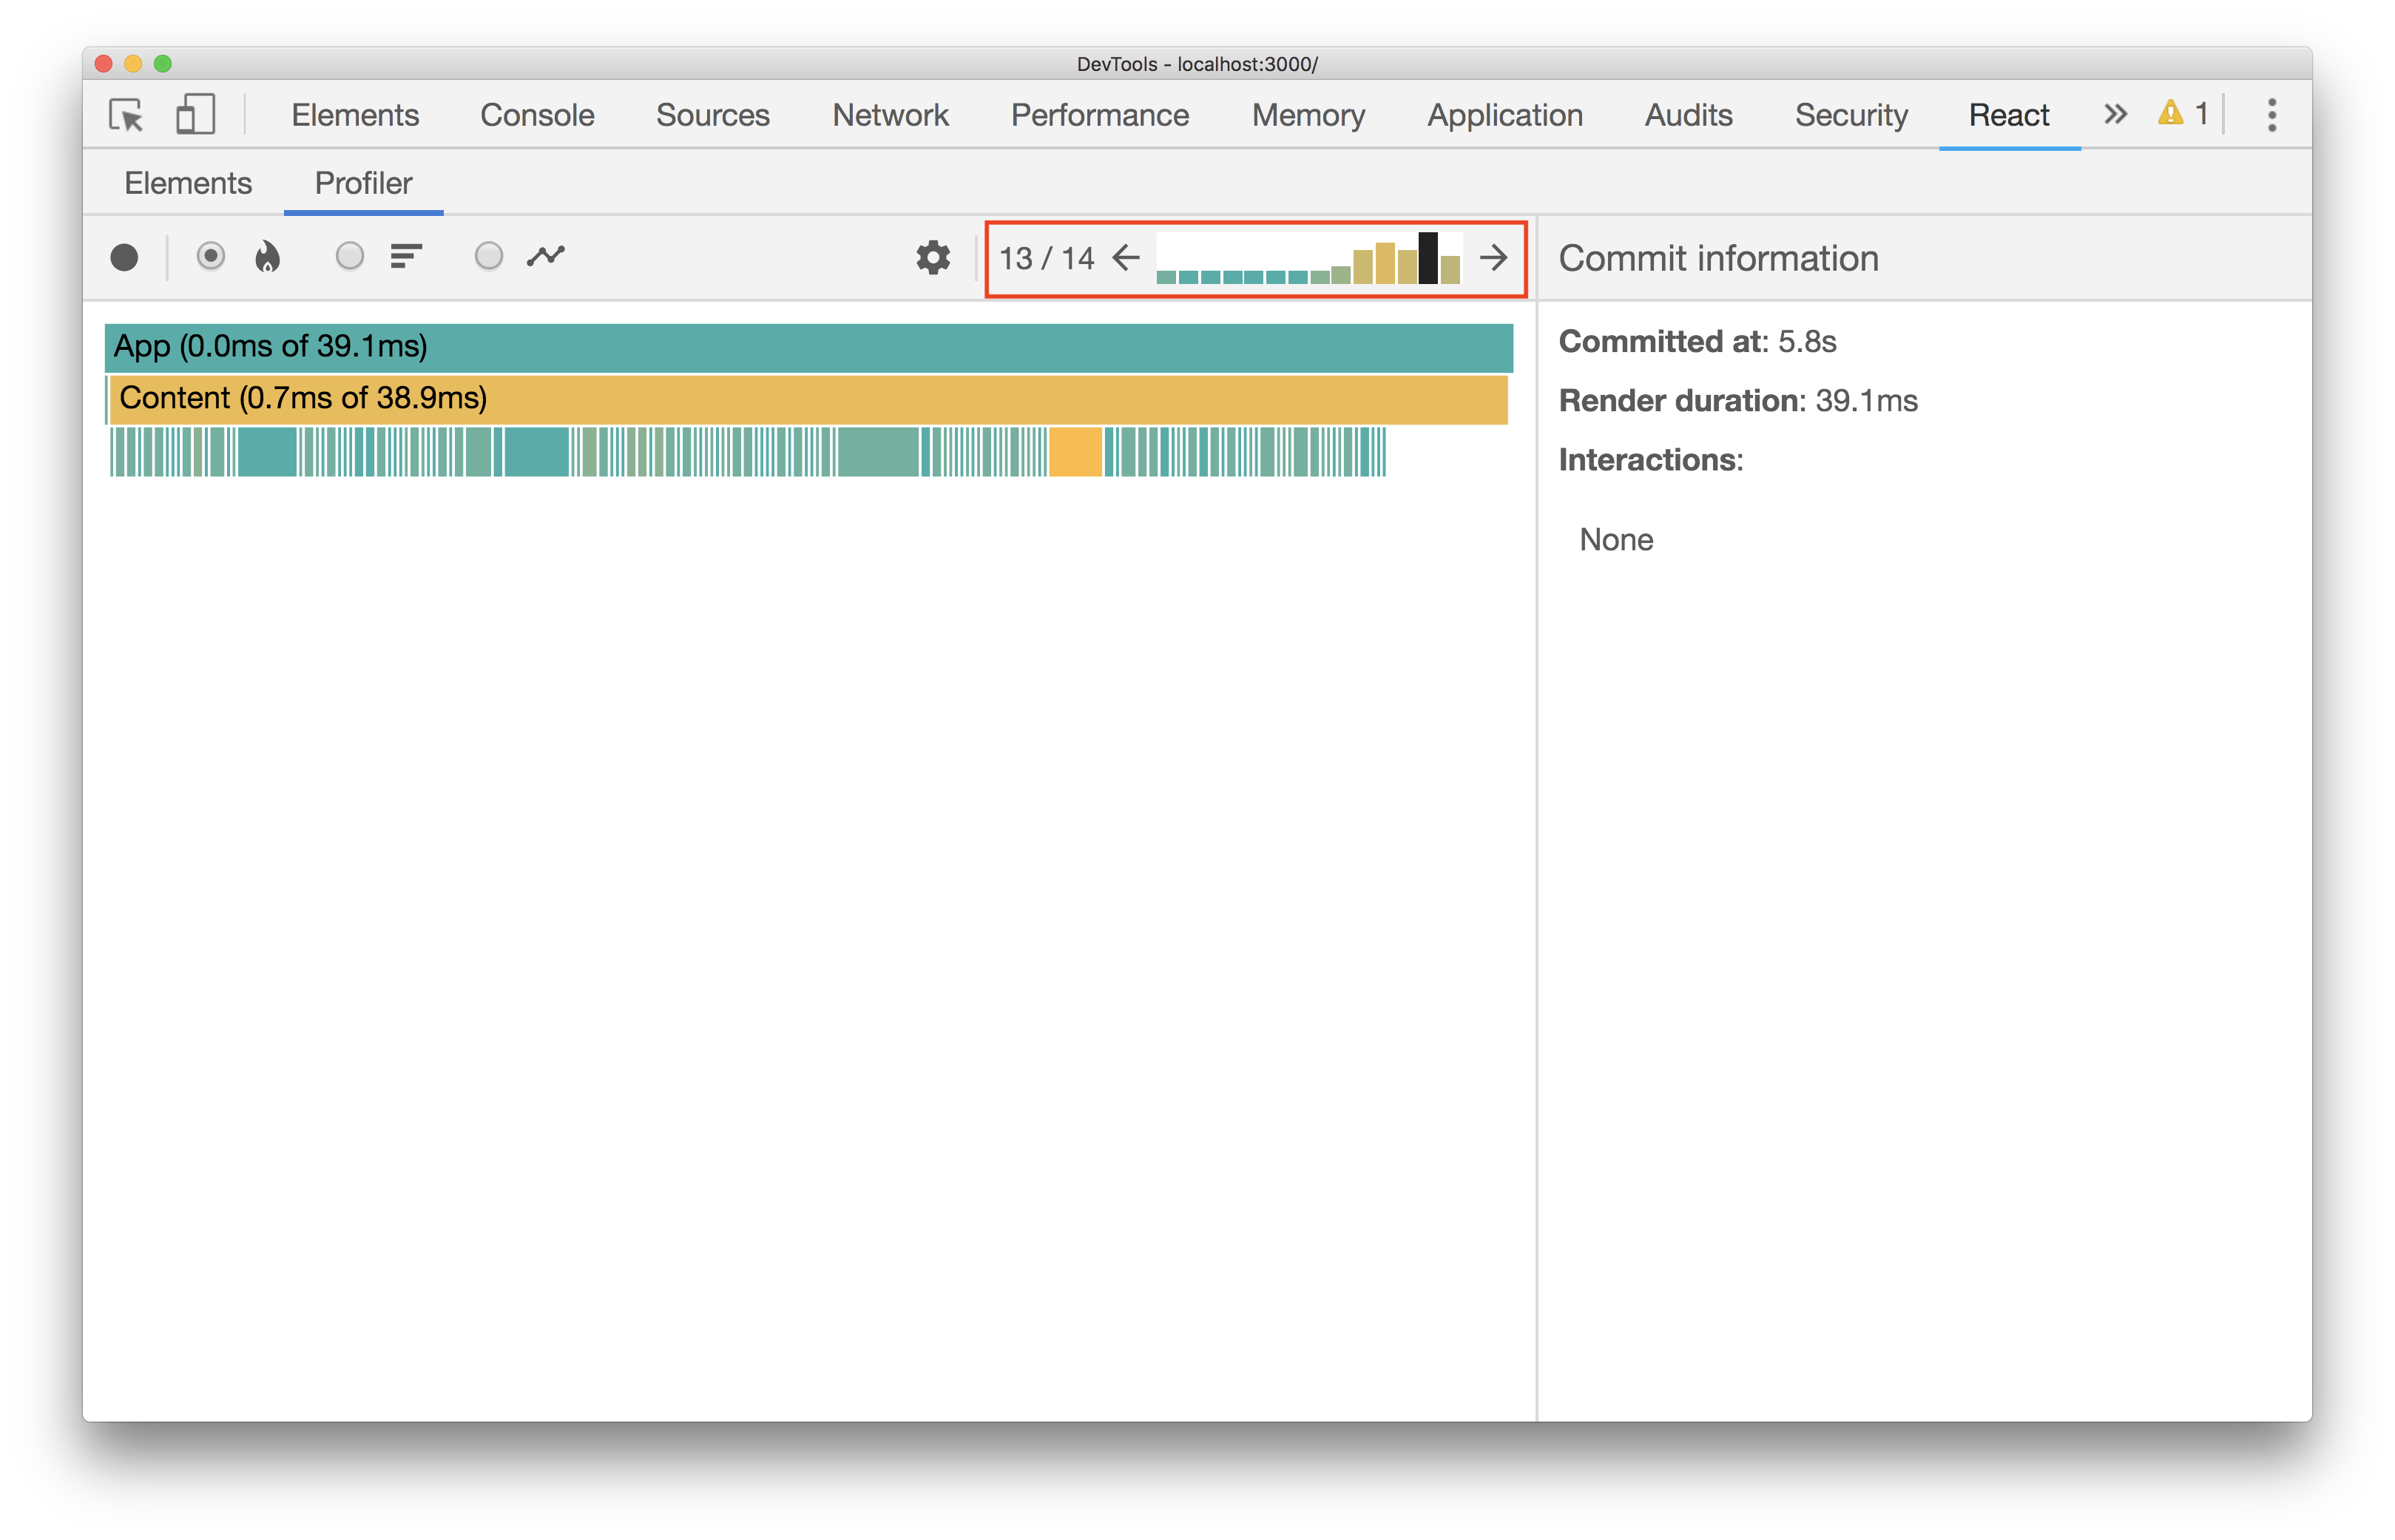
The later commits all have longer and more yellow bars in the chart. This means that the time it takes for all the components to finish rendering takes longer as the list on the page grows. This happens because every component in the list re-renders with each new API call. This helps identify an issue that can be resolved relatively quickly: every single item on the list does not need to be re-rendered when new items are being added.
Minimize unecessary re-renders
There are quite a few ways to minimize and remove unecessary re-renders in a React app:
- Override
shouldComponentUpdate
shouldComponentUpdate(nextProps, nextState) {
  // return true only if a certain condition is met
}- Use
PureComponentfor class components
import React, { PureComponent } from 'react';

class AvatarComponent extends PureComponent {

}- Use
memofor functional components
import React, { memo } from 'react';

const AvatarComponent = memo(props => {

});- Memoize Redux selectors (with reselect for example)
- Virtualize super long lists (with react-window for example)
Measure app-level performance
Aside from specific DOM mutations and component re-renders, there are other higher level concerns worth profiling for as well. Lighthouse makes it easy to analyze and assess how a particular site performs.
There are three ways to run Lighthouse tests on a webpage:
- Node CLI
- Chrome Extension
- Directly through Chrome DevTools in the
Auditspanel
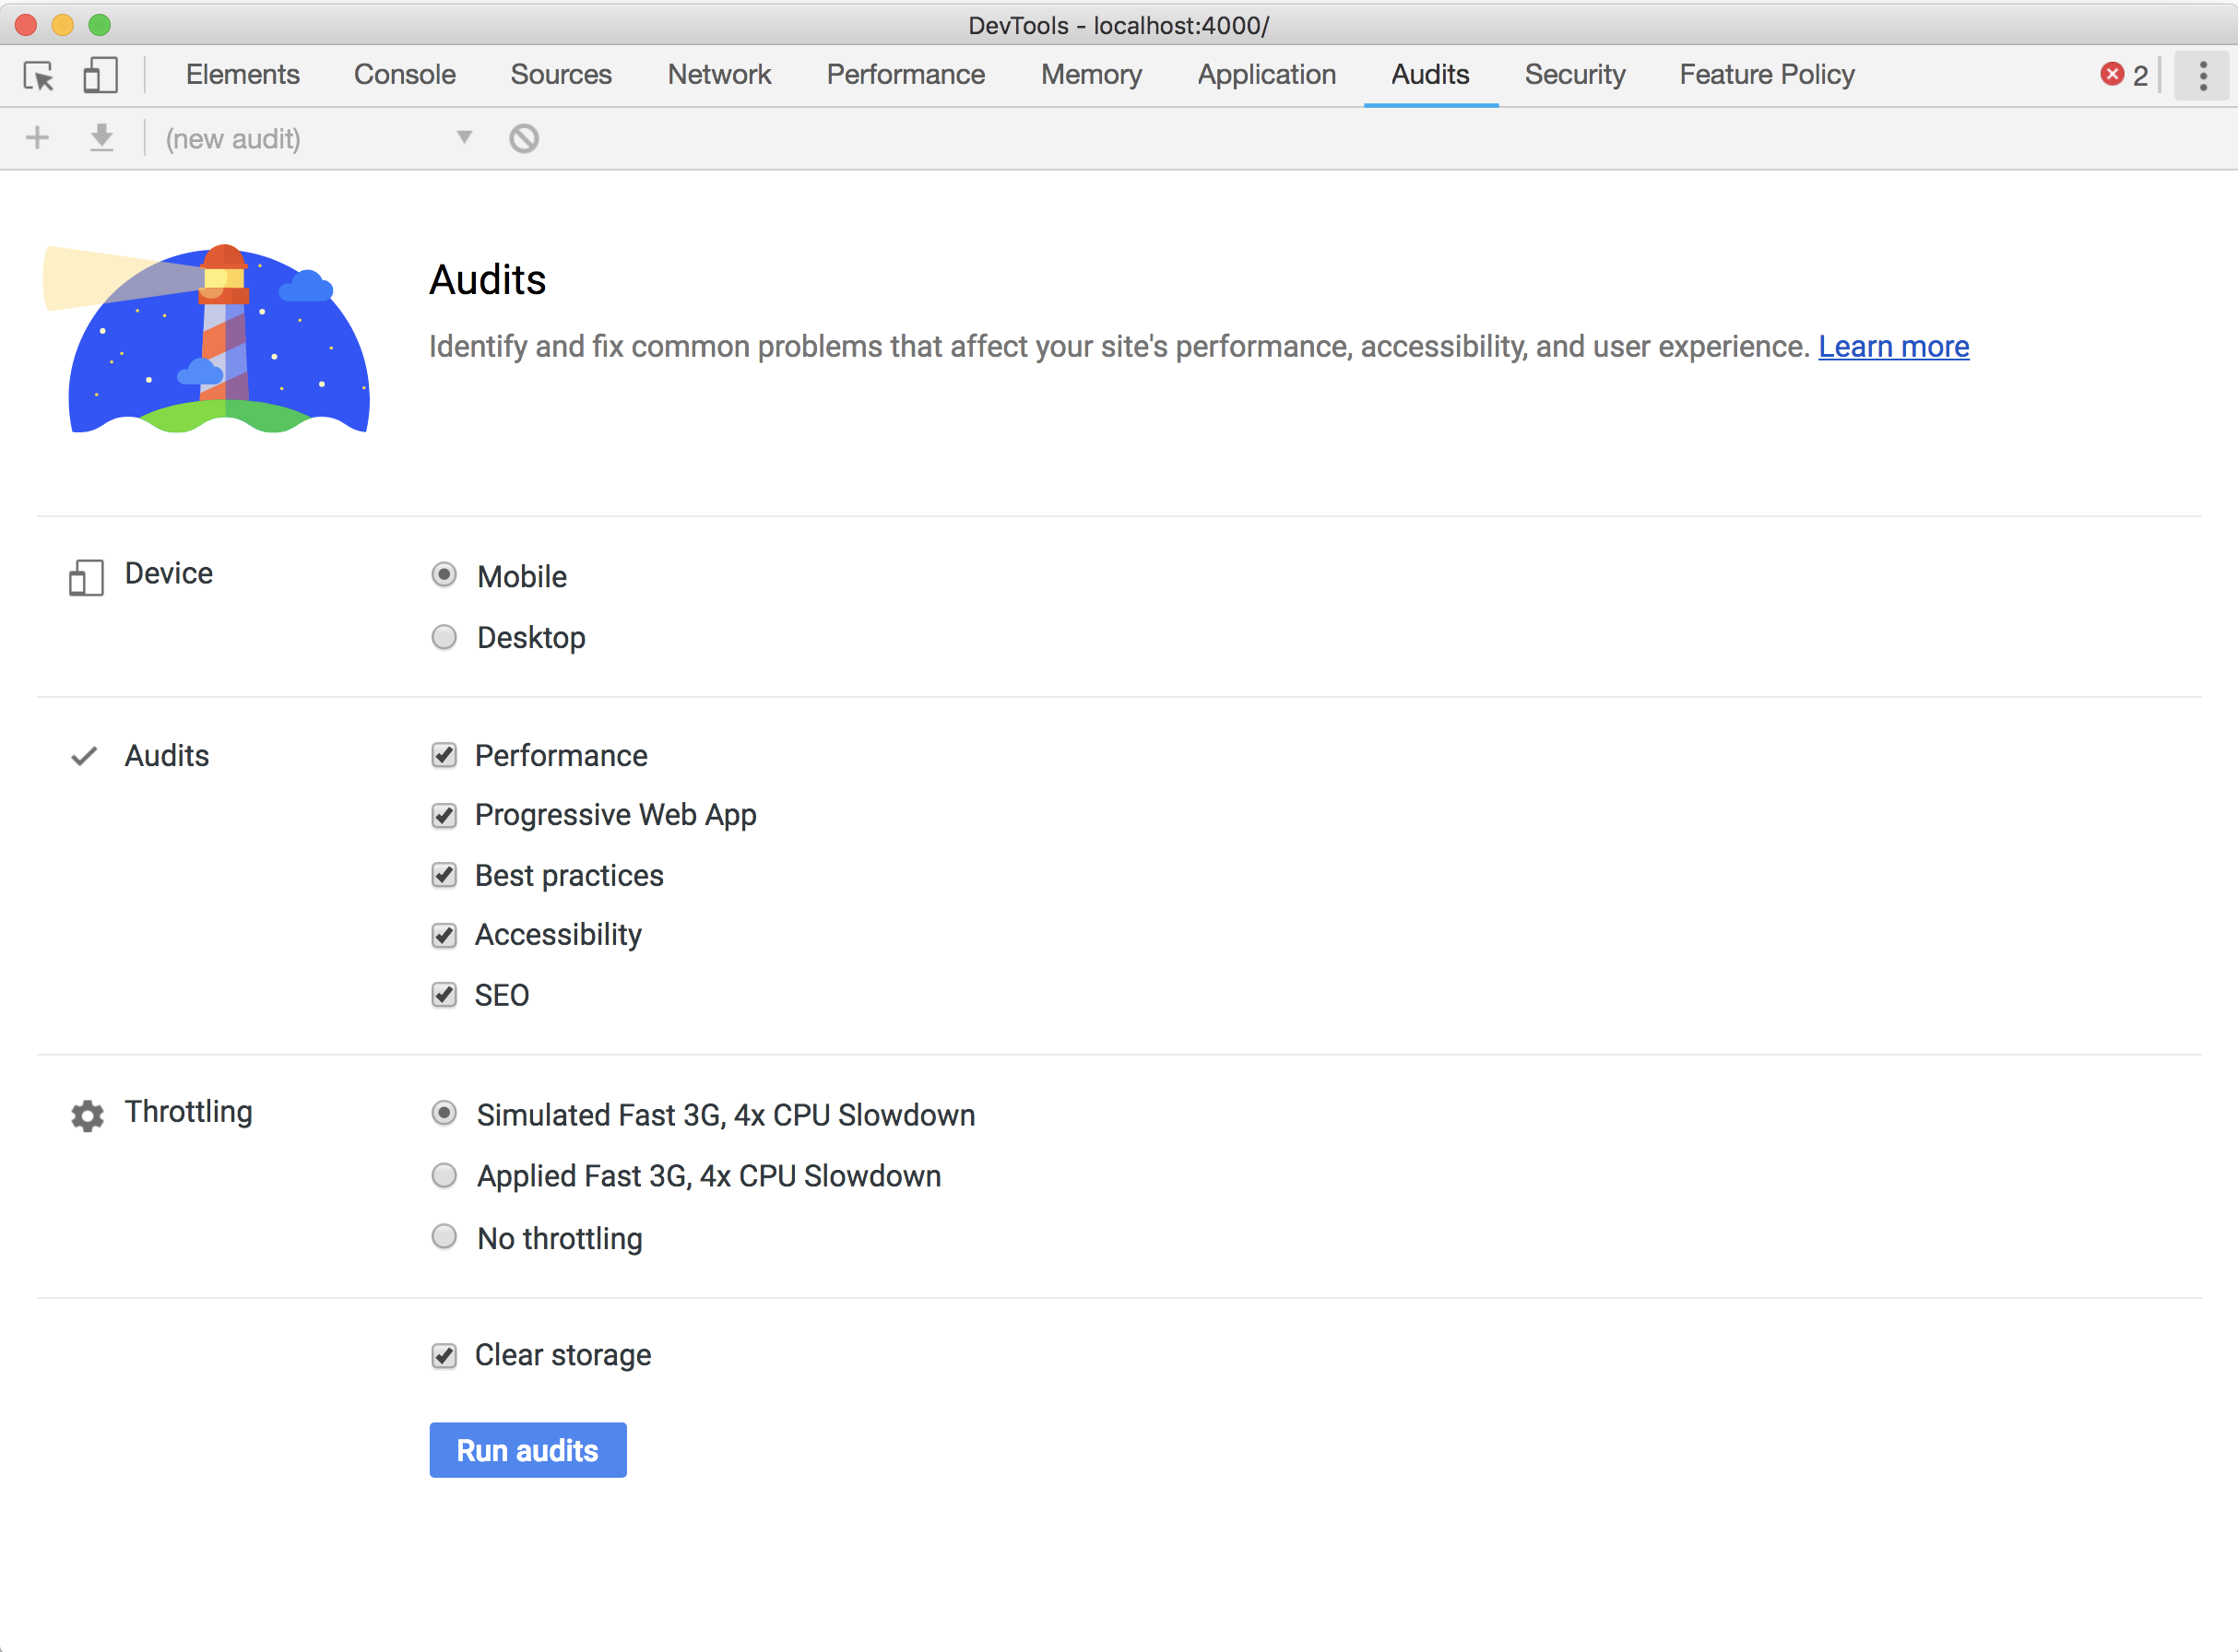
Lighthouse usually takes a little time gathering all the data it needs from a page and then auditing it against a number of checks. Once that’s complete, it generates a report with all of the final information.
A number of audits can be used to identify if the amount of JavaScript being shipped to the browser should be reduced:
- Eliminate render-blocking resources
- JavaScript boot-up time is too high
- Avoid enormous network payloads
If any of these audits fail due to large JavaScript bundles, splitting your bundle should be the very first thing that you consider doing. There’s no reason to load more code than necessary if there is a way split things up.
Split your bundle
One way to code-split is to use dynamic imports:
  import('lodash.sortby')
    .then(module => module.default)
    .then(module => doSomethingCool(module))
The import syntax may look like a function call, but it allows you to import any module asynchronously where a promise gets returned. In this example, the sortby method from lodash is imported where doSomethingCool is then fired.
Dynamic imports are a relatively new syntax and are currently in stage 3 of the TC39 process. The syntax is already supported in Chrome and Safari as well as module bundlers like Webpack, Rollup and Parcel.
In the context of React, abstractions have been built to make the process of splitting on the component-level while using dynamic imports even easier. React.lazy is one example:
import React, { lazy } from 'react';

const AvatarComponent = lazy(() => import('./AvatarComponent'));
One of the main concerns of loading different parts of an application asynchronously is handling the delay that a user can experience. For this, the Suspense component can be used to “suspend” a certain component tree from rendering. By using it alongside React.lazy, a loading indicator can be shown as a fallback while a component is still being fetched:
import React, { lazy, Suspense } from 'react';
import LoadingComponent from './LoadingComponent';

const AvatarComponent = lazy(() => import('./AvatarComponent'));

const PageComponent = () => (
  <Suspense fallback={LoadingComponent}>
    <SomeComponent />
  </Suspense>
)
Suspense does not yet work if your views are rendered on the server. If you would like to code-split in a server-side rendered React app, use a library like loadable-components as suggested in the React docs.
import React from 'react';
import loadable from '@loadable/component'
import LoadingComponent from './LoadingComponent';

const AvatarComponent =
  loadable(() => import('./AvatarComponent'), {
    LoadingComponent: () => LoadingComponent
  });
Loading components can also be used as indicators with loadable-component while the main component is still being fetched.
Code-split on scroll?
Another handy library that provides a wrapper around loadable-components and Intersection Observer is react-loadable-visibility. You can use it to load components as they become visible within the device viewport when the user scrolls the page.
import React from 'react';
import loadableVisibility from 'react-loadable-visibility/loadable-components'

const AvatarComponent = loadableVisibility(() => import('./AvatarComponent'), {
  LoadingComponent: Loading,
})
Cache things worth caching
A service worker is a web worker that runs in the background of your browser when you view a webpage.
The idea behind service workers is to include specific functionality on a separate thread that can improve the user experience. This includes caching important files so that when your users make a repeat visit, the browser can make a request to the service worker instead of all the way to the server which improves how fast the page loads on repeat visits.
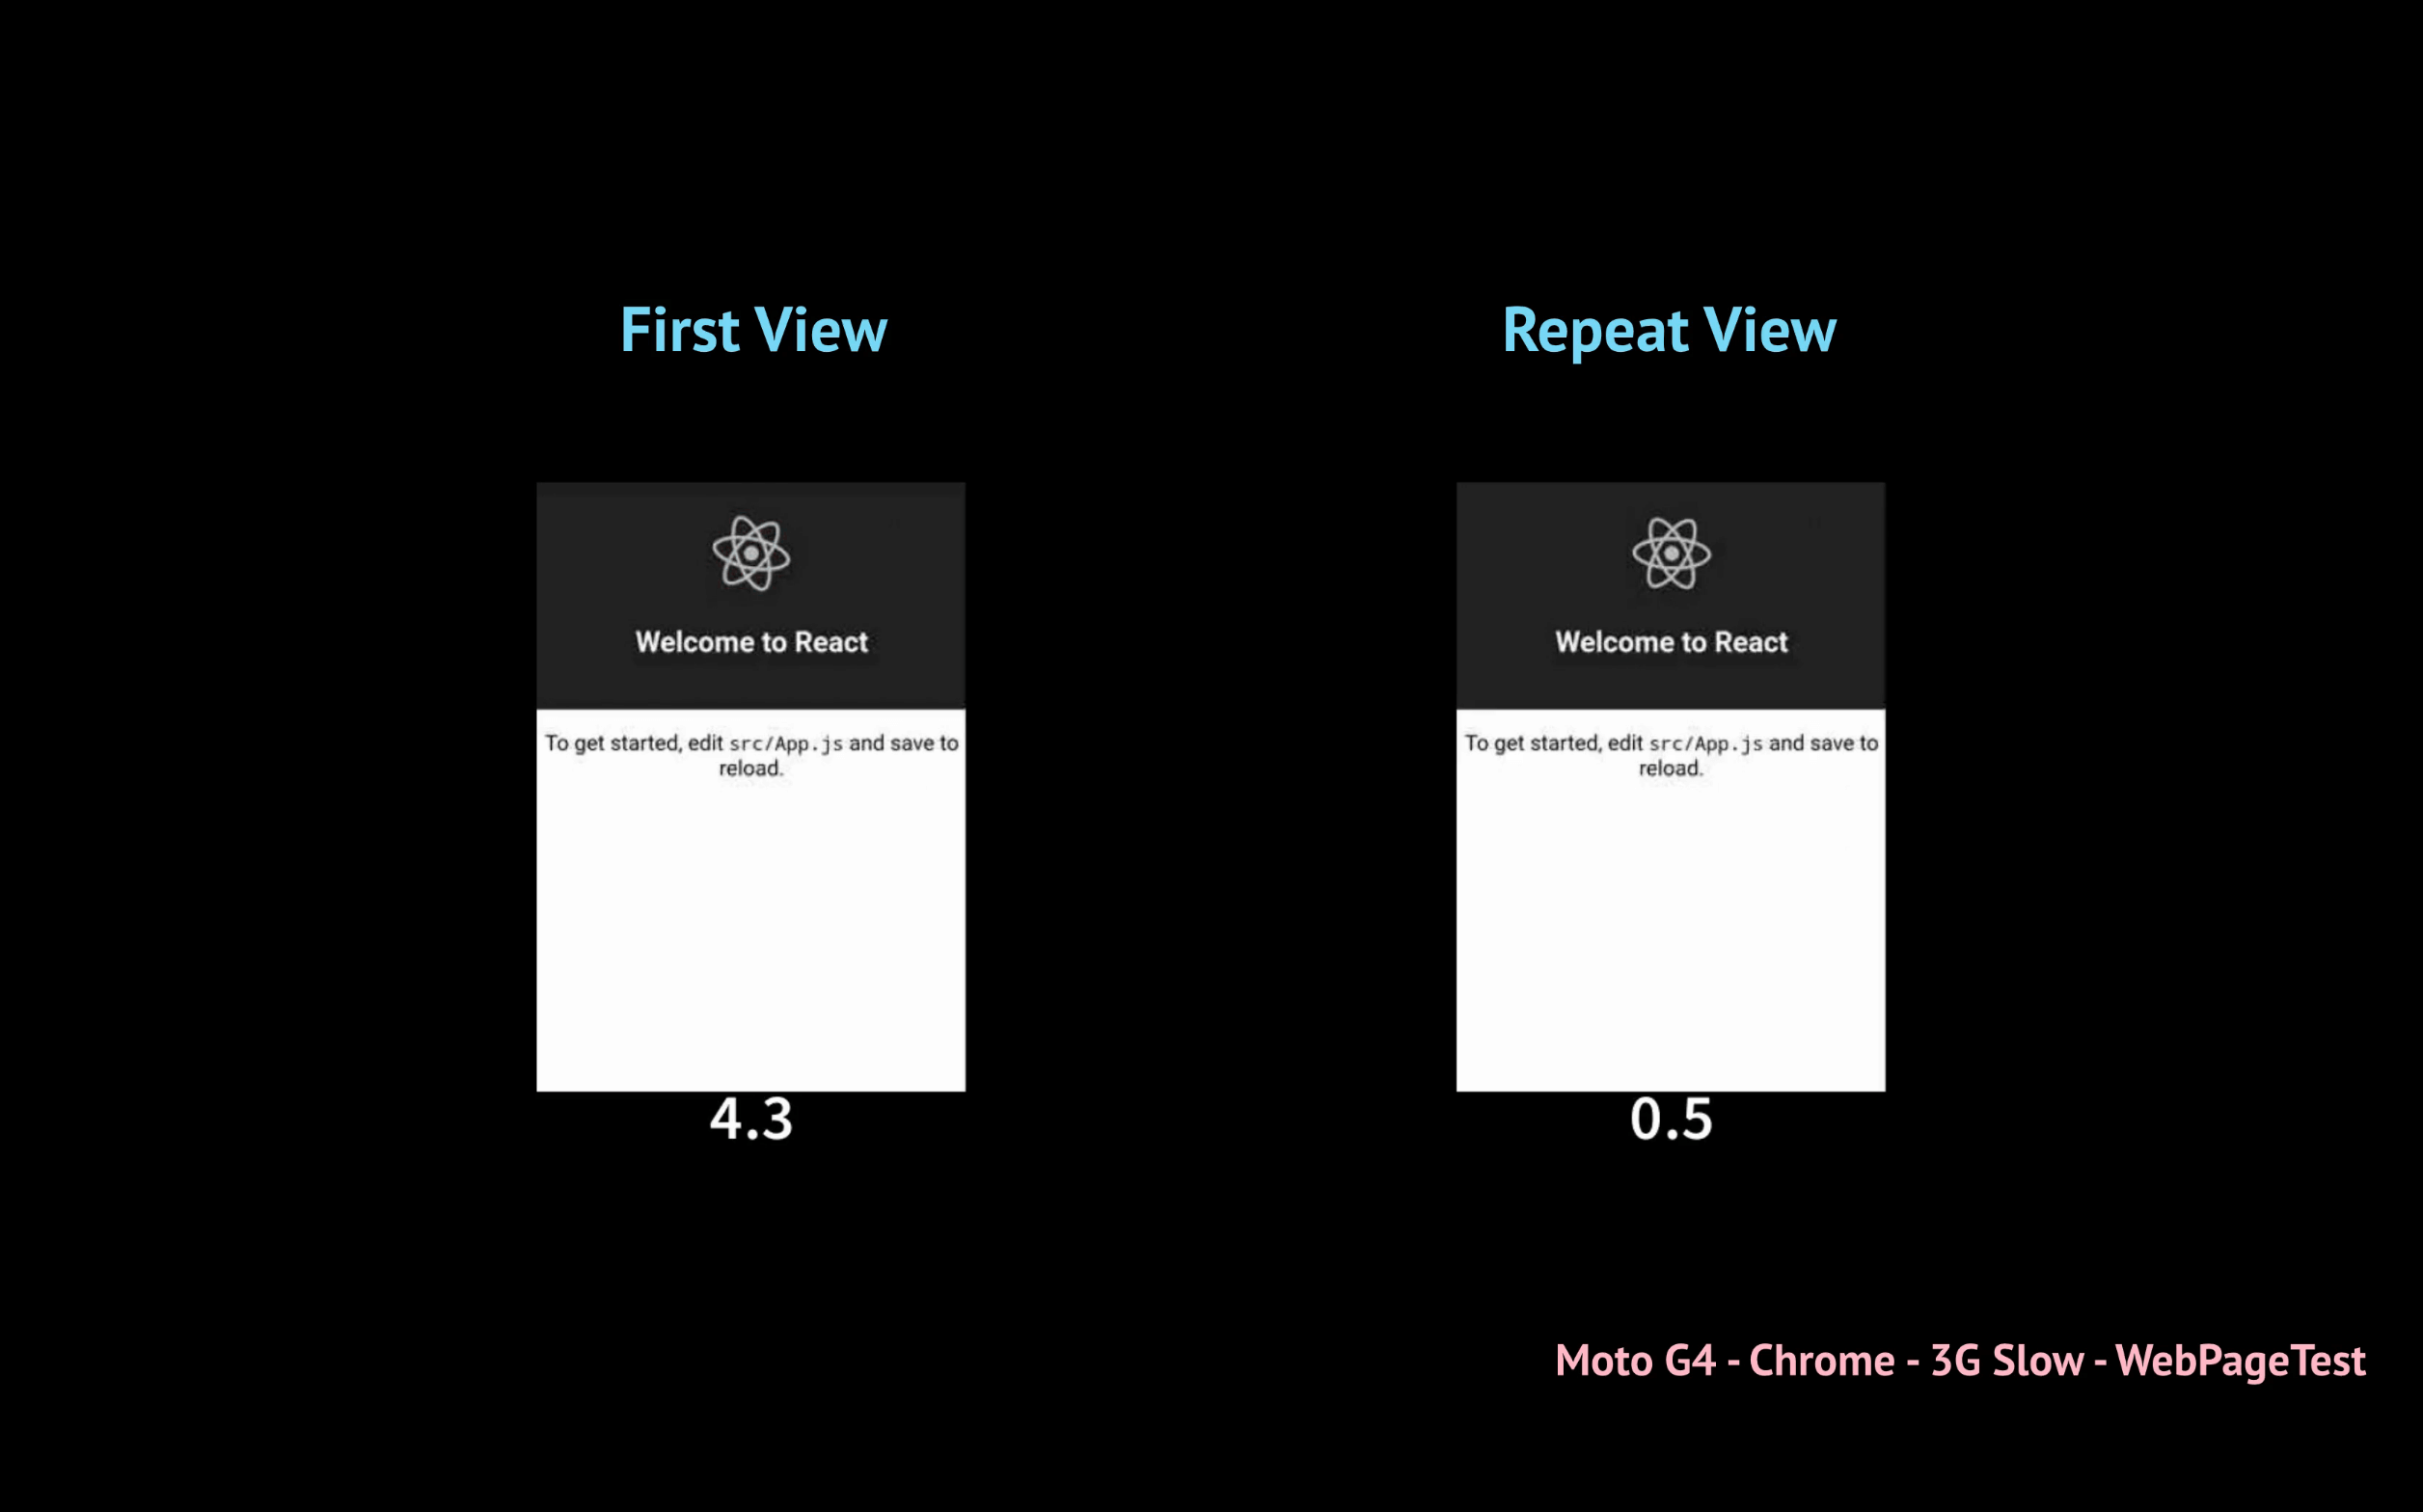
Workbox is a set of libraries that can make it easier to include service workers without actually writing one from scratch. With CRA 2.0, you only need to remove 2 characters in src/index.js to have a workbox-powered service worker up and running with basic caching functionality.
  import React from 'react';

  //...

  // If you want your app to work offline and load faster, you can change
  // unregister() to register() below. Note this comes with some pitfalls.
  // Learn more about service workers: http://bit.ly/CRA-PWA
  serviceWorker.unregister();
Streaming SSR
The basic idea of server-side rendering on a mainly client-rendered application involves shipping down an HTML document from the server that the client would have eventually produced. This allows you to display content to the user much sooner than them waiting for the JS bundle to finish executing.
To make sure this works well, you need to ensure that the browser re-uses the server-rendered DOM instead of re-creating the markup (with hydrate() for example in React). This makes things seem like a page has loaded faster, but it can delay the time it takes for it to become interactive.
With React 16, you can take advantage of streaming while server-side rendering your components. Instead of using renderToString to return an HTML string, you can use renderToNodeStream to return a Node Readable stream of bytes. Streaming from a server allows a client to receive and hydrate different parts of the HTML document instead of all at once. Although SSR should always improve First Paint times in your application, this would reduce that number even further.
Can’t SSR? Pre-render instead
The definition of SSR is a little blurry since there are many different ways servers can ship some, instead of all, the static content needed for a specific URL and how a client can hydrate it. Prerendering, or static rendering, is a middle-ground between entirely server-side rendering pages on the fly and pure client-side rendering. This approach usually involves generating HTML pages for every route during build time and serving that to the user while a JavaScript bundle finishes compiling.
If you would like to introduce pre-rendering into your application, libraries like react-snap that take advantage of Puppeteer can make things easier for you.
Extract critical CSS-in-JS styles
Many developers in the React community use CSS-in-JS libraries like emotion and styled-components for a multitude of reasons (component-scoped styles, automatically generated selectors adjusted properties based on props, etc…). If you’re not entirely careful, you can run into the issue of having all the styles being computed at runtime. This means that the styles only get applied when the JavaScript bundle finishes executing which can trigger a flash of unstyled content. Like most performance concerns, this gets exemplified if your user happens to have a weaker mobile device or poorer network connection.

Screenshot from denar90
If you’ve already incorporated some sort of server-side rendering into your application, you can fix this by extracting critical styles. Both emotion and styled-components support this out of the box where you can extract your styles into a Readable node stream. Glamor has a separate library that allows you to do the same thing as well.
Extracting critical styles can improve things quite substantially for users with weaker devices or network connections:

This is actually a Preact app, but you get the idea :) (optimizations by denar90)
Make things accessible
The term “progressive” usually means that an attempt was made to ensure that all users have the opportunity to access at least some content of the site, if not all of it. If you don’t ensure that your site is accessible to users with a disability, it is not progressive.
Lighthouse is a good first step to identify any accessibility concerns on a web page. To find issues that are more specific to React elements, React A11y can help.
You can also consider using react-axe to audit the final, rendered DOM instead of just the JSX in your application.
Improve the experience when users install the site to their home screen
Does your React site work well on mobile? Do you have a service worker that caches some content so that it works offline? Is your application useful enough that you think people would like to access it on their device homescreen?
If you answered yes to all these questions, add a web app manifest to your site so that your users can get a better mobile experience when it’s “installed” on their device. This lets you change a number of settings including the app icon, background color and theme color.
Create React App already sets up a default manifest for you when you create a new app:
{
  "short_name": "React App",
  "name": "Create React App Sample",
  "icons": [
    {
      "src": "favicon.ico",
      "sizes": "64x64 32x32 24x24 16x16",
      "type": "image/x-icon"
    }
  ],
  "start_url": ".",
  "display": "standalone",
  "theme_color": "#000000",
  "background_color": "#ffffff"
}
Miscellaneous
The new few sections will cover techniques commonly used to only improve developer experience but also have the advantage of minimizing the amount of code written.
Why is this useful? Less code = less bytes shipped = faster web page.
Atomic CSS
The idea behind Atomic styling is to define single-use classes that are focused, small and identifiable. For example, a single class would be used to add a blue background to a button:
<button class="bg-blue">Click Me</button>
A separate class would be responsible for giving it a specific amount of padding:
<button class="bg-blue pa2">Click Me</button>
And so on. Although this would add a lot more values to the class attribute for most of your DOM nodes, you get the added benefit of not writing nearly as much CSS as you normally would if you use a library that sets up all the selectors for you. Tachyons is one example of such a library.
Scoping styles to components using atomic utility classes has become a common styling pattern for many developers. Libraries such as tachyons-components even let you apply these styles using a styled-components like API:
import styled from 'tachyons-components'

const Button = styled('button')`
  bg-blue pa2
`

<Button>Click Me</Button>
Although it may not be the primary reason why developers use atomic utility libraries like, removing the need to create new CSS selectors by relying entirely on a fixed set of single-use classes means that the amount of CSS shipped to the browser never changes.
Hooks
Hooks allow you to do a bunch of things with functional (no-class) components that you could have only previously done with class components. Including state is one example:
import { useState } from 'react';

function AvatarComponent() {
  const [name, setName] = useState('Houssein');

  return (
    <React.Fragment>
      <div>
        <p>This is a picture of {name}</p>
        <img src="avatar.png" />
      </div>

      <button onClick={() => setName('a banana')}>
        Fix name
      </button>
    </React.Fragment>
  );
}
Hooks can be useful for:
- Including state into a component without using a
class(useState) - Including side effects without using a
class(useEffect) - Re-using logic between components by creating your own hooks.
This all lets you incorporate logic into your components in such a way that it can be reused in other places of your application. Prior to hooks, recompose was commonly used to get some of these capabilities.
Although most developers will decide to use Hooks to improve the experience of tying logic into their components, it can also help cut down bundle sizes.
In terms of the implementation size, the Hooks support increases React only by ~1.5kB (min+gzip). While this isn’t much, it’s also likely that adopting Hooks could reduce your bundle size because code using Hooks tends to minify better than equivalent code using classes.
Conclusion
When a open-source tool, like React, ends up being used by so many developers - it’s natural to expect two things:
- Improved APIs within the tool to make building applications easier
- New third-party libraries built by the community that help make building applications easier
“…make building applications easier” can mean a lot of things, and shipping apps that load faster with less effort is just a part of it.
If you have any questions or suggestions, feel free to open an issue!